11/12/26
As discussed in last weeks blog, The Tech Stock Tea Just Got…Hotter?, there’s a lot happening behind the scenes that can influence where our money goes. Now all the Headlines are revolving around a crash in the market, or not i.e. Stock market crash: What history says comes next after the market’s big single-day dip. I say, it depends how you frame it, and how you want to see it.
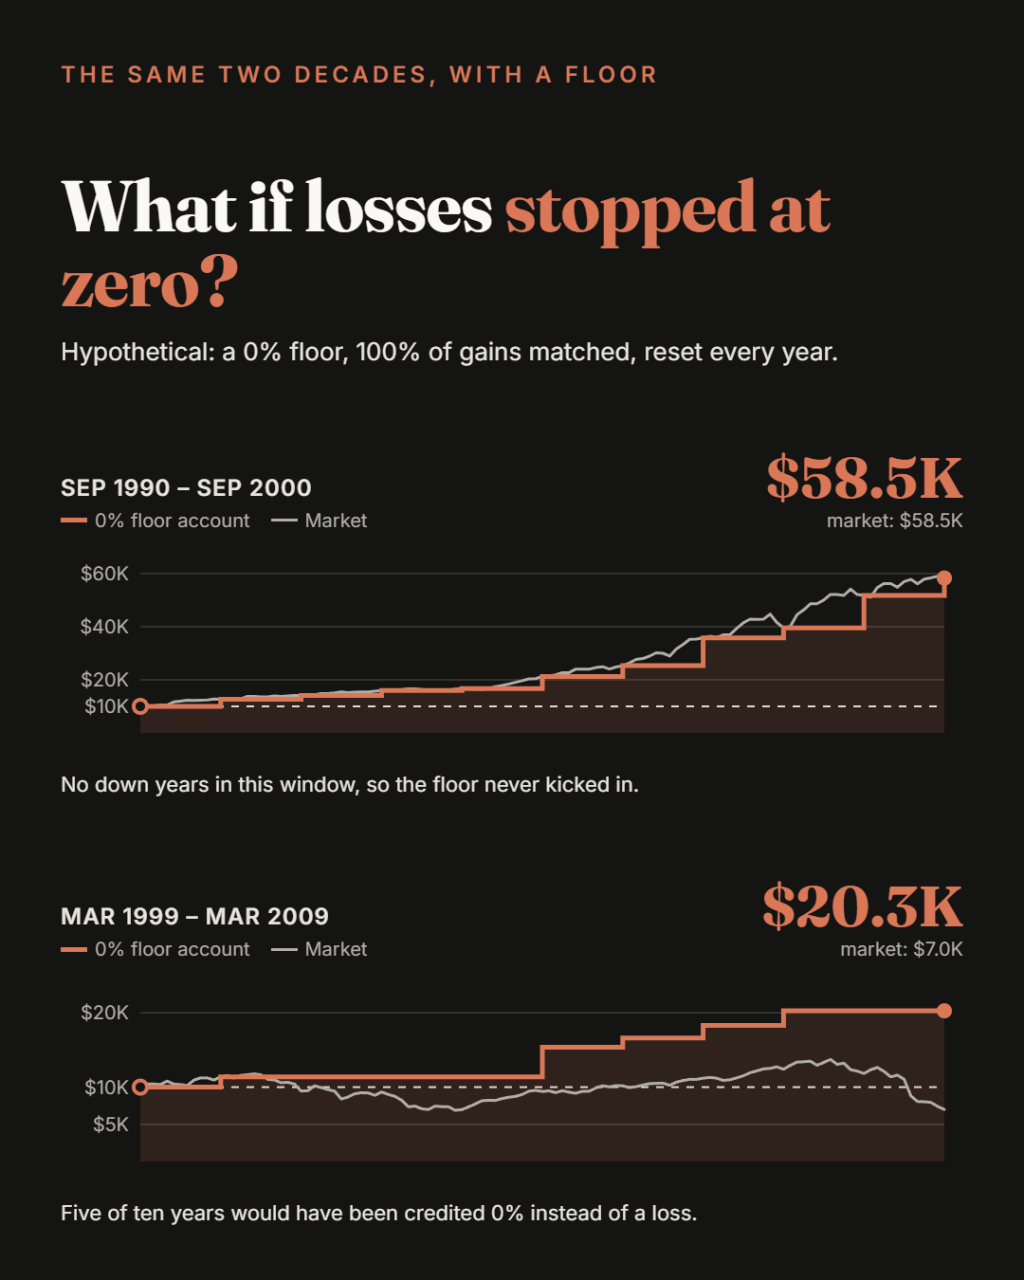
I love this nifty tool from MarketReturnData where we can see the history for ourselves and to our interpretation. I will give the example in a 10 year period using the S&P 500, which is one of the most commonly followed measures of the U.S. stock market. Imagine you do a one time $10,000 investment, September 1990 through September 2000. During this stronger ten-year period, the annualized return was approximately 19.33%. That hypothetical $10,000 would have grown to around $58,546.
Now, let’s reimagine the same scenario but a different timeframe of March 1999 and March 2009, the S&P 500 experienced one of its weakest rolling ten-year periods. Including reinvested dividends, the annualized return was approximately -3.52%. A hypothetical $10,000 investment would have been worth roughly $6,988 at the end of that period.
Source: Historical S&P 500 Rolling Returns. Figures include reinvested dividends and are before taxes, fees, and inflation.
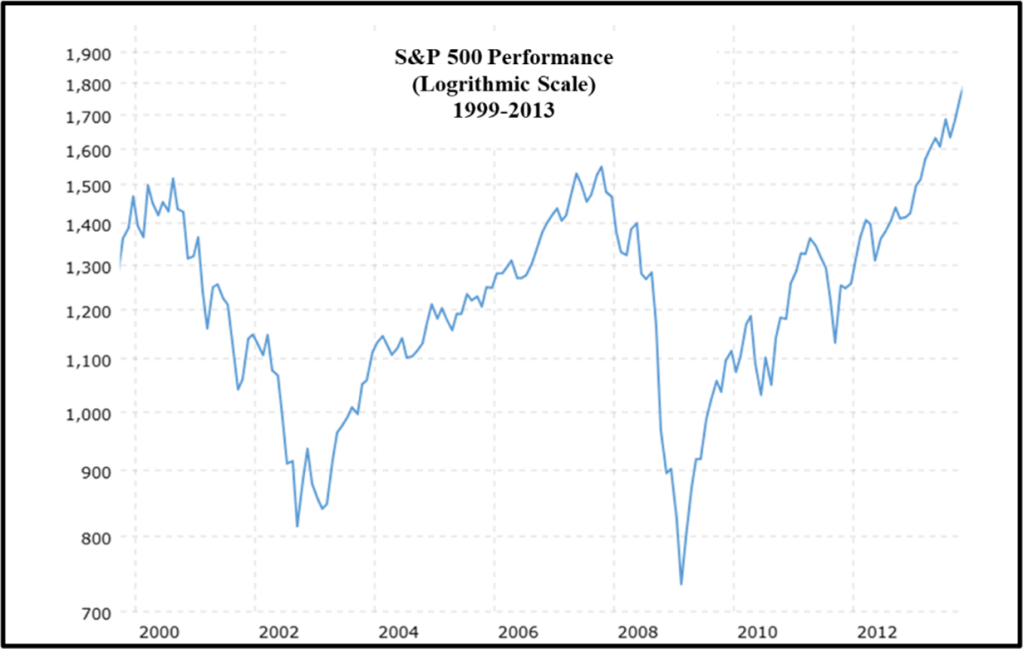
Not bad on both sides, but let’s remember what we talked about in Has Your Advisor Told You About the Difference Between Average Return vs. Actual Return? And the difference in average (annualized) and actual (cumulative) where the highs are higher and the lows are lower. AND there is the switch to turn on inflation, which brings everything down once that is accounted for!
It’s easy to look at a chart over 30 or 40 years and focus on the overall upward direction. It’s also easy to zoom in on one particularly difficult year and feel like the entire market is falling apart.
But neither view tells the whole story on its own.
A person who is 25 and investing for retirement may have decades to experience market ups and downs. Someone who is 63 and preparing to withdraw money may have a very different relationship with that same market decline.
Consider:
Before you ask “what is the market doing?”, ask “what is my timeframe?”
If you needed your money tomorrow, would your financial strategy look the same as if you didn’t need it for another 20 years?


Leave a Reply